What must a sensor stability claim establish?
A research partner sends a bladder-sensor report with an attractive pressure trace and a statement that the device remained stable. Before using that statement in a development decision, specify the proposed use: detecting a change in pressure, estimating its amplitude, or tracking a resting pressure over time. These claims demand different evidence. An evaluator needs a clear connection between the proposed measurement, the calibration supporting it and the period actually observed.
This article focuses on pressure-sensor offset and sensitivity. It uses selected engineering and feasibility papers as worked examples, rather than attempting a census of every bladder-sensing technology. The outcome is a practical record of what was measured and what remains uncertain. It does not rank architectures, prescribe clinical pressure thresholds or establish performance for Silicon Life's investigational systems.
What is drifting: the baseline or the response?
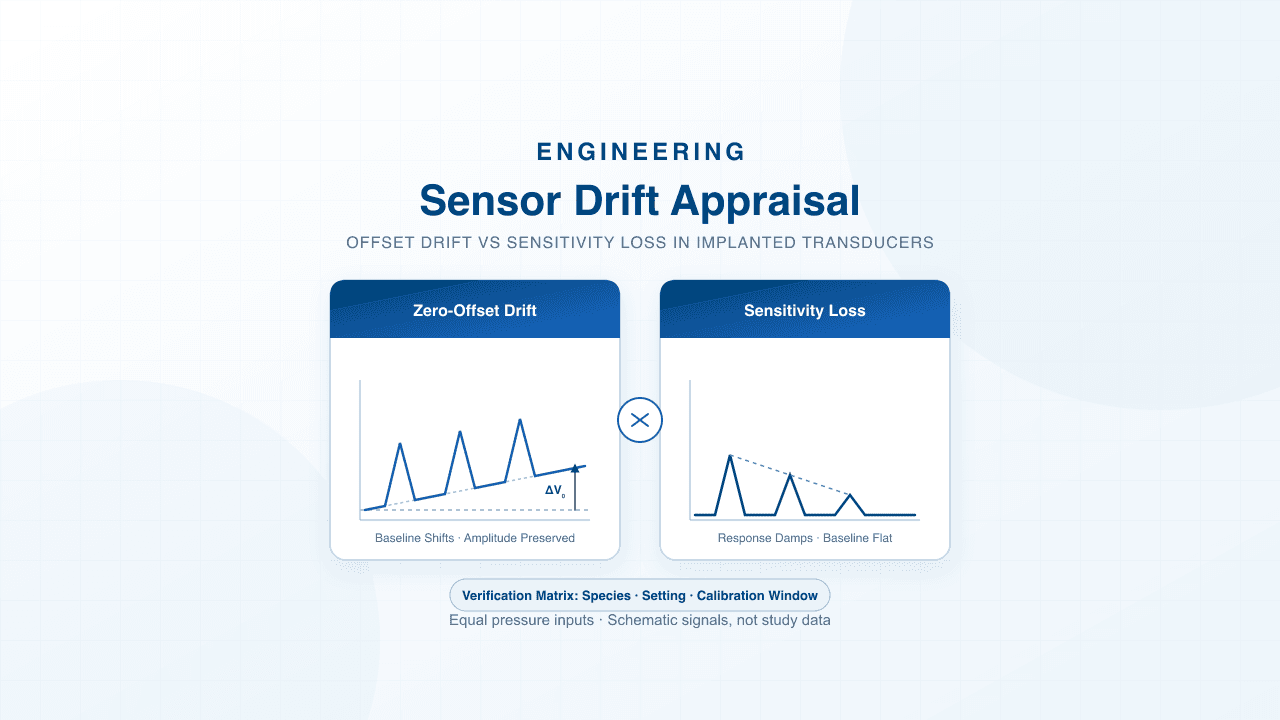
A useful local linear model is V(t) = S(t) × P(t) + V₀(t) + e(t). Here, output V depends on pressure P, sensitivity S, baseline offset V₀ and an error term e. This is an explanatory model, not a specification for every sensor. Offset drift changes the intercept; sensitivity drift changes the slope. The distinction appears in both the bladder-sensor methodological review and the broader implanted-pressure-sensor review.23
Consider a hypothetical sensor with a baseline of 10 mV and sensitivity of 1 mV/cmH2O. A 20 cmH2O input gives 30 mV. If the baseline later rises to 15 mV with unchanged sensitivity, the output becomes 35 mV. If instead sensitivity falls to 0.8 mV/cmH2O with the original baseline, the output becomes 26 mV. These invented values illustrate the model; they are not device results or clinical thresholds.
One observation cannot distinguish these explanations. If both baseline and sensitivity change, their errors can even cancel at one pressure while remaining substantial elsewhere. A reviewer should therefore ask for evidence that separates an intercept change from a slope change. When a study supplies only a baseline correction or a normalized trace, record which part of that distinction remains unresolved.
| Reading field | Offset / baseline drift | Sensitivity change |
|---|---|---|
| Meaning | Output changes at the same reference pressure. | Output change per unit pressure changes. |
| Evidence to request | Baseline trajectory, units, reference condition and uncertainty. | Response across stated pressure points, repeated over time. |
| Potential ambiguity | A baseline shift may include changes in the actual pressure or reference conditions. | Reduced amplitude may reflect pressure transmission at the implant site as well as the transducer. |
| What a single adjustment leaves open | Zeroing alone does not identify a changed slope. | Rescaling alone does not establish a stable baseline. |
| Suggested report wording | State offset change under the specified conditions and observation window. | State sensitivity change under the specified conditions and observation window. |
Source: Editorial interpretation of the offset/sensitivity distinction in Dakurah et al. (2015) and Yu et al. (2014); proposed reporting fields, not mandatory acceptance criteria.
The reviews describe material aging, mechanical fatigue and interactions with the implanted environment as possible sources of drift. They also discuss packaging and tissue response. Those mechanisms explain why stability deserves investigation; they do not identify the cause of a particular trace by inspection. Nor does a decrease in response after placement necessarily demonstrate progressive material degradation. Immediate attenuation and a time-dependent loss of sensitivity need separate descriptions.23
What changed after placement in the animal example?
Majerus and colleagues studied a wired suburothelial prototype in three animals: one nonsurvival feline, one nonsurvival canine and one survival canine followed to a terminal procedure on postoperative day 13. Before placement, each device received a two-point calibration, using atmospheric pressure and a 30-cm water column. The resulting sensitivity was assumed constant for that animal study. This is the calibration assumption of one investigation, not a universal preclinical method.4
The authors observed reduced sensitivity in all animals and baseline drift of approximately 2 cmH2O per minute in the nonsurvival feline. These effects had not appeared in bench calibration. Pressure sensitivity returned toward pre-implantation behavior when the sensors were moved into the lumen. The authors proposed effects of the implantation site, including urothelial damping and possibly trapped air, as explanations; the study was not designed to quantify those mechanisms.4
For appraisal, the important point is the distinction between an observation and its cause. The feline drift rate is not a population estimate, a demonstrated rate in humans or a rate to extrapolate across an arbitrary recording period. Reduced sensitivity in this experiment likewise does not establish a common percentage of attenuation for implanted sensors. Record the observed direction of change and the authors' causal uncertainty together.
The study normalized signals to compare contraction-related changes and reported windowed correlations. For example, the feline result was r = 0.93 ± 0.03. That analysis addressed the intended event-detection question while leaving absolute pressure agreement unresolved. Repeated contraction windows within one animal are also different from replication across animals. A high correlation can be useful evidence for a limited engineering question without supplying a calibration-lifetime estimate.4
In the survival canine, recordings were collected intermittently during a 10-day experimentation period after a three-day healing interval. The ambulatory phases had no simultaneous reference catheter and were interpreted qualitatively. Later signals became nonphysiological; the terminal assessment found erosion through the detrusor and cable damage. The authors considered tethering an important contributor. It would be misleading to describe this as 13 days of continuously verified pressure calibration or to attribute every signal failure to electronic drift.4
Which duration does the report actually verify?
For each source, create separate entries for elapsed implantation time, recording coverage and reference comparisons. Then add calibration dates and any recalibration. A long follow-up period may contain brief, well-referenced sessions. A long recording may contain no independent pressure reference. Both can be useful, but they support different statements about persistence of calibration.
Longer follow-up does appear in the literature. Kim and colleagues reported a wireless strain-based bladder-monitoring platform in rats and baboons. The authors report concordance with conventional urodynamics for up to eight weeks in a nonhuman primate partial-cystectomy model, with a normal-bladder animal for comparison. The strain signal was calibrated to pressure against urodynamics, and those reference studies were intermittent snapshots rather than a continuous pressure reference alongside the telemetry. This is preclinical evidence from a different sensing architecture. It cautions against treating the longest interval in any one selection of studies as a field-wide limit, while leaving device-specific baseline and sensitivity verification to be examined.6
| Evidence example | Observation window | What it establishes and leaves open |
|---|---|---|
| BioCAS offset-cancellation design (2015) 1 | Bench step response and offline analysis of 40 ten-minute human pressure recordings. | Circuit response and dynamic-range analysis; not a chronic implant calibration study. |
| Suburothelial wired prototype (2017) 4 | Acute reference comparisons; intermittent survival recordings; terminal assessment on day 13. | Placement-related attenuation and drift were observed. Ambulatory recordings lacked simultaneous reference pressures. |
| UroMonitor feasibility study (2023) 5 | Single-visit use in 11 women. | Short-term event-capture feasibility, with static-pressure limitations; not a longitudinal drift estimate. |
| Strain-based bladder monitor (2024) 6 | Wireless strain recordings in rats and baboons; intermittent urodynamic comparisons reported up to eight weeks in a primate partial-cystectomy model. | Longer follow-up in another architecture; intermittent reference checks are not continuous verification of offset and slope. |
Source: Selected primary examples, not an exhaustive duration ranking. Sources 1, 4, 5 and 6 are linked in the surrounding text and source list.
The comparison is deliberately not a league table. Sensor location, measured quantity, processing and reference coverage differ. A literature review's inclusion criteria can also exclude relevant architectures. A maximum found in one review is therefore a maximum within its included set, not automatically a ceiling for the entire field. For a development dossier, request the underlying study and identify what its longest interval actually measures before using it to support a lifetime claim.
What does offset cancellation preserve?
Majerus and Damaser evaluated a mixed-signal cancellation loop using a bench step test and offline processing of 40 ten-minute human bladder-pressure recordings. The latter analysis reported an average 2.9-bit increase in effective dynamic range for 8-bit instrumentation. The design transmits both the faster signal and the offset information, rather than simply discarding the baseline. The authors distinguish that approach from AC coupling, which loses static-pressure information.1
Keeping a signal inside an instrument's range is valuable. It does not, by itself, establish whether the original pressure-to-output relationship remains calibrated. In the explanatory model above, recentering V₀ does not identify a change in S. When assessing cancellation, ask which signal is available before and after correction and whether both components needed for reconstruction are retained. Label a range result as a range result; reserve an accuracy statement for a comparison with an appropriate reference.
Packaging deserves similar separation. The pressure-sensor review describes coating-related trade-offs in sensitivity, signal-to-noise ratio and response time. These are reasons to assess the finished sensing assembly, rather than assuming a protective coating preserves the bare sensor's response. They are not universal penalties for every material or thickness. Distinguish an initial change introduced by packaging from additional change during aging.3
A useful mitigation report contains the original problem, the intervention and the remaining measurement question. For example, a smoother corrected trace may answer a display or range problem while concealing how much baseline information was removed. Conversely, an uncorrected trace may look worse while retaining information needed to investigate drift. Reviewers should compare the claimed function and retained information, rather than treating visual smoothness as evidence of stability.
Does agreement on events establish calibrated pressure?
The UroMonitor pilot enrolled 11 women for single-visit testing and captured 85 of 87 urodynamic events (98%). Two participants were excluded from quantitative analysis because of radio interference; reception and data collection were modified during the study. Static low-volume pressure agreement was problematic, which the authors attributed provisionally to packaging, and analysis was limited to pressure events. The prototype measured pressure only. The authors disclosed licensed intellectual property and an investor relationship; data collection and analysis predated those interests. This was non-blinded feasibility work, not chronic calibration or superiority evidence.5
This example supports a precise evidence request: identify whether a result describes event capture, waveform correlation, pressure differences or drift over time. These are different outcomes. Correlation alone cannot establish numerical agreement, and an event-capture percentage is not a pressure-error bound. A trace can track the direction of change while its baseline or scale is wrong. Equally, a limited event-detection study can meet its own objective without resolving every absolute-pressure question.
When a report quotes an average pressure difference, ask about its spread and dependence on conditions before turning it into a tolerance. Opposite signed errors may average toward zero. When it quotes a correlation, ask whether the data were normalized or selected around events. Neither request supplies a universal pass criterion; both help ensure the evidence answers the specific claim your project intends to make.
A drift evidence worksheet for a research review
Use this proposed worksheet to prepare an evidence meeting or research-collaboration discussion. It records a claim and its supporting observation, rather than assigning a numerical quality score. For every row, name the document or figure, note the tested configuration and leave a visible gap where the evidence does not answer the question. The framework is editorial synthesis from the distinctions above; it has not been validated as an assessment instrument.
| Field | Evidence to request | How it changes the decision |
|---|---|---|
| Claim and drift form | Exact claim; separate baseline and sensitivity results; units and reference conditions. | Prevents one stability adjective from standing for two unmeasured properties. |
| Calibration provenance | Initial calibration date, points, medium and conditions; subsequent checks or adjustments. | Shows what was measured again versus assumed to remain constant. |
| Time coverage | Implant duration, recording periods and simultaneous reference-check dates. | Bounds the interval over which calibration persistence was examined. |
| Same-device comparison | Before-placement and later results for identified devices and configurations. | Helps separate placement effects from changes over time or different devices. |
| Processing and reconstruction | Raw signal, correction history, retained offset data and normalization description. | Identifies information removed before the reported result was calculated. |
| Agreement measure | Pressure-error distribution and conditions, alongside any event or correlation metric. | Keeps amplitude accuracy separate from event-related evidence. |
| Mitigation and recalibration | Which drift form is targeted; access to a reference; evidence for the proposed correction. | Distinguishes a demonstrated correction from an assumed maintenance route. |
| Uncertainty and follow-up | Unresolved mechanisms, relevant configuration changes and the next verification question. | Makes the remaining work explicit before a broader claim is adopted. |
Source: Editorial worksheet informed by sources 1–6; no universal acceptance thresholds or required clinical procedures are implied.
Begin with the claim that matters to the next project decision. If it concerns baseline stability, a normalized event trace leaves a key question open even when its correlation is high. If it concerns retained response magnitude, a baseline-zeroing log leaves the slope question open. Where both are required, record evidence for both. The appropriate outcome of review may be to accept a narrower statement and request an additional measurement for the broader one.
A practical record can have a short claim sentence, a source location, the observed interval and a separate uncertainty sentence. For a fictional dossier stating 'stable during follow-up,' that record might read: 'Repeated reference comparisons support the reported response during the sampled sessions; behavior between sessions was not independently checked.' This is a wording example, not a finding about any cited device. It preserves useful evidence without making the unobserved period disappear.
Recalibration also needs a documented pathway. The 2015 bladder-sensor review contrasts catheter-based sensors, which are recalibrated against an external reference, with implanted sensors, for which it states recalibration is impossible without surgical intervention. The later animal study instead suggests that regular maintenance calibrations against a catheter reference could become necessary, but it did not test such a procedure. Treat reference access as a design-specific question rather than settling it from either general statement. Evaluate what a particular design proposes, what intervention that entails and whether the correction has been demonstrated under the claimed conditions.24
Source lineage, limits and update needs
The 2014 cross-organ review and 2015 bladder review provide terminology and design context. They are older sources, and their overlapping discussion should not be counted as independent device validation. The cancellation paper, wired-animal study and UroMonitor pilot share investigators from the Cleveland research programme. The Kim study adds another research group and architecture; it is useful counter-evidence, not a head-to-head comparison.123456
Sources were checked on 1 November 2026. This is a selected-source engineering appraisal, with no pooled estimate or comprehensive claim about the longest available sensor lifetime. Its worksheet is intended to remain useful when new studies appear. Recheck it when a study separately tracks offset and sensitivity over a longer period, reports a new reference-update method, or changes how corrected data are reconstructed. New follow-up evidence can improve the answer without making different sensing architectures interchangeable.
Where Silicon Life fits
Silicon Life develops urological devices and investigational implantable systems. Its research pipeline includes an electronically controlled artificial-bladder programme with proposed multimodal sensing. These are development directions, not demonstrated pressure-sensor accuracy, drift correction or monitoring duration. Every pipeline programme remains investigational and unavailable for sale.8
The company’s separate Disposable Sterile Controlled Catheter is a Class II device registered in China only, for female patients with voiding dysfunction; it is not indicated for men or authorized for sale in other markets. That registration supplies no evidence of implantable sensing performance.7
For a research discussion, bring the exact measurement claim, its supporting study and the calibration questions left open by this worksheet to a research-collaboration enquiry. This is a discussion of investigational work, not an offer of a clinically available sensor. The companion wireless-power explainer addresses a separate implant constraint, while the bladder-emptying architecture review places sensing within the wider system question.
Frequently asked questions
Can one calibration point distinguish offset drift from sensitivity loss?
Generally, one point leaves both an intercept and a slope to explain. Under the simple linear model, multiple combinations produce the same output at that point. Request measurements that distinguish the two, including the conditions and uncertainty. Do not infer retained sensitivity simply because a device can be zeroed.
Does a coating-induced sensitivity reduction mean the sensor is drifting?
An initial response reduction after packaging differs from a further response change over time. Either can matter to a performance claim, but they answer different questions. Record the calibration of the finished assembly and the later observations separately; avoid describing every attenuation effect as progressive sensitivity drift.
How should a reviewer interpret a long follow-up period?
Ask which measurements occurred during it. Retention, power availability, recording continuity and agreement with a reference have different time coverage. Identify the actual reference-check sessions and any recalibration. Follow-up can support a persistence claim within those observations while leaving the intervals between them unverified.
References
- 1Majerus S, Damaser MS. Automatic Drift Cancellation of Implanted Bladder Pressure Sensor. IEEE Biomedical Circuits and Systems Conference (BioCAS) 2015; doi: 10.1109/BioCAS.2015.7348430 (PMC8064017, PMID 33899050).
- 2Dakurah MN, Koo C, Choi W, Joung Y-H. Implantable Bladder Sensors: A Methodological Review. International Neurourology Journal, 2015;19(3):133–141.
- 3Yu L, Kim BJ, Meng E. Chronically Implanted Pressure Sensors: Challenges and State of the Field. Sensors, 2014;14(11):20620–20644 (PMC4279503, PMID 25365461).
- 4Majerus SJA, Fletter PC, Ferry EK, Zhu H, Gustafson KJ, Damaser MS. Suburothelial Bladder Contraction Detection with Implanted Pressure Sensor. PLoS ONE, 2017;12(1):e0168375.
- 5Frainey BT, Majerus SJA, Derisavifard S, Lewis KC, Williams AR, Balog BM, Butler RS, Goldman HB, Damaser MS. First in Human Subjects Testing of the UroMonitor: A Catheter-free Wireless Ambulatory Bladder Pressure Monitor. Journal of Urology, 2023;210(1):186–195 (PMC11675714, PMID 37293725).
- 6Kim J, Bury MI, Kwon K, et al. A wireless, implantable bioelectronic system for monitoring urinary bladder function following surgical recovery. PNAS, 2024;121(14):e2400868121; doi: 10.1073/pnas.2400868121 (PMC10998577, PMID 38547066). Primary paper; preclinical strain-based sensing.
- 7Silicon Life. Disposable Sterile Controlled Catheter: public registration scope and indication. Company source.
- 8Silicon Life. Research pipeline: investigational artificial-bladder programme and development targets. Company source.
Silicon Life. Implantable bladder sensors: separate baseline drift from sensitivity loss. SILICON·LIFE Insights. 1 November 2026.

Silicon Life develops urological devices and implantable systems in Wuhan, China. Its Insights are written for healthcare professionals, with the sources for each article listed in full.
This article is provided for educational purposes for healthcare professionals. It does not constitute medical advice and does not replace the Instructions for Use of any device. Product availability and indications differ by country.
New articles on urology devices and implant engineering.
Clinical reviews, engineering notes and company news from Silicon Life, sent when new articles are published.
Occasional emails. Unsubscribe at any time.